Web Dashboard
The web dashboard provides a real-time view of the labgrid coordinator’s state, including exporters, places, resources, and reservations.
Access the dashboard at http://localhost:3000 after starting the Docker
compose stack (see Coordinator Setup).
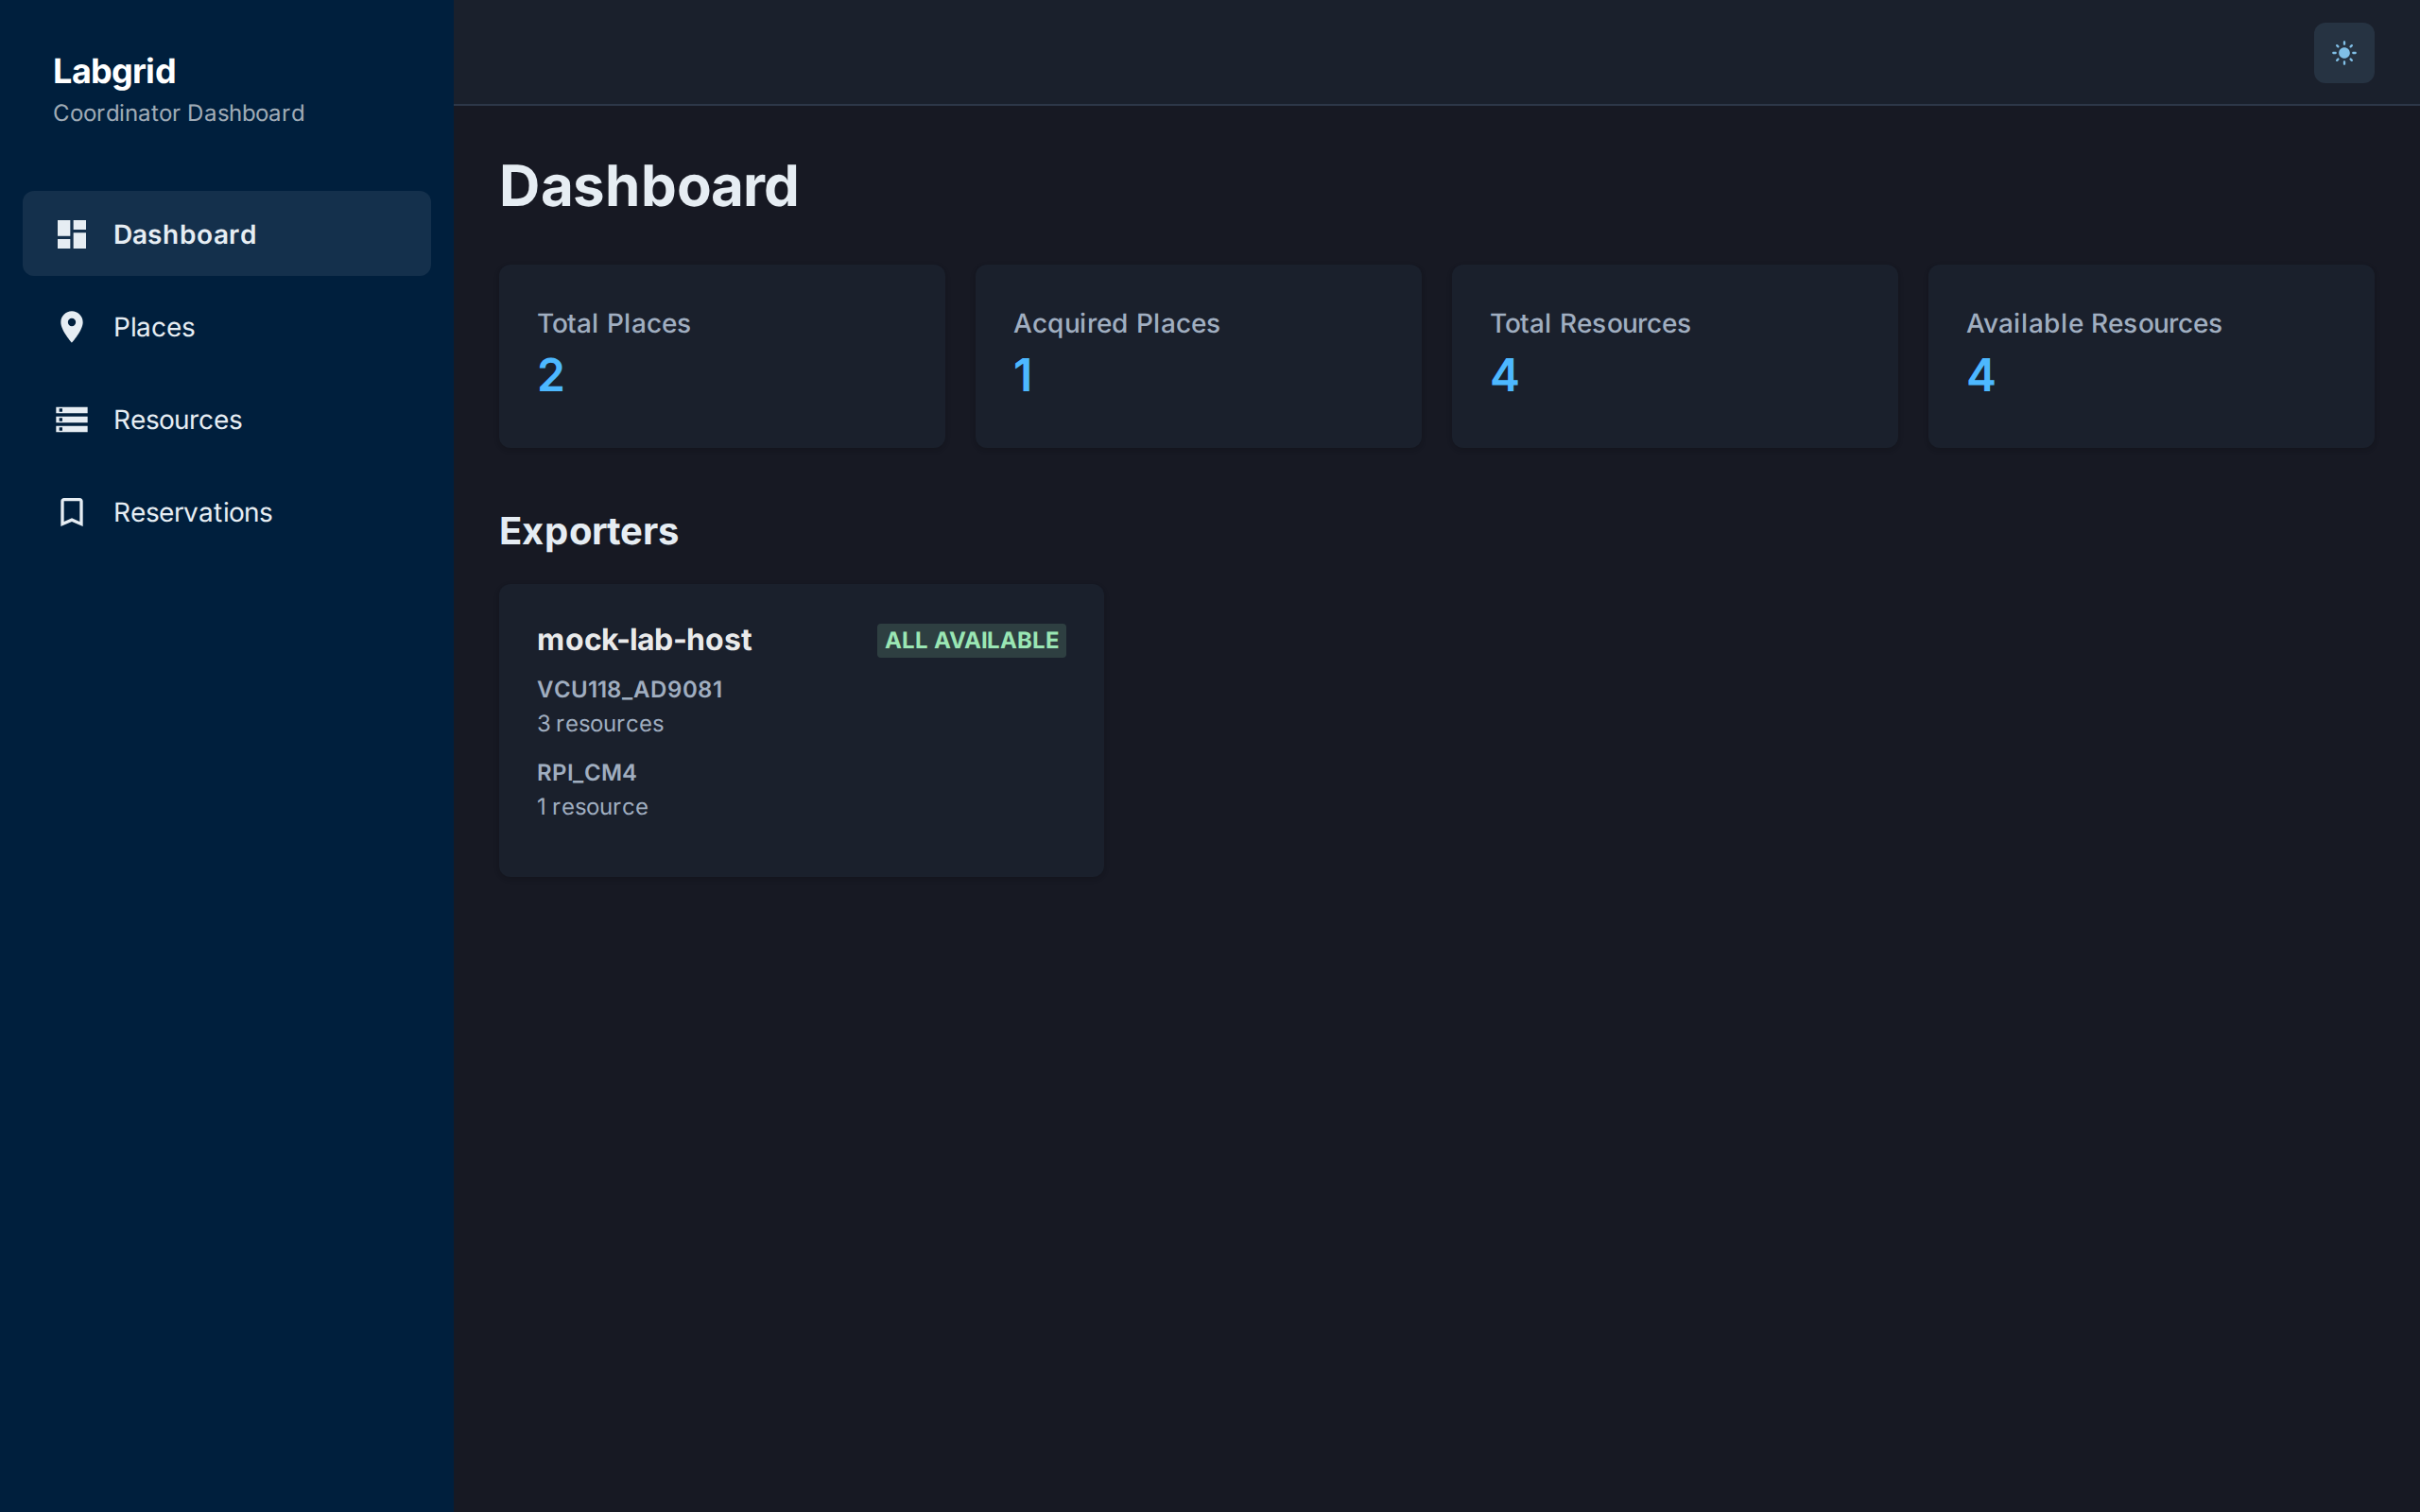
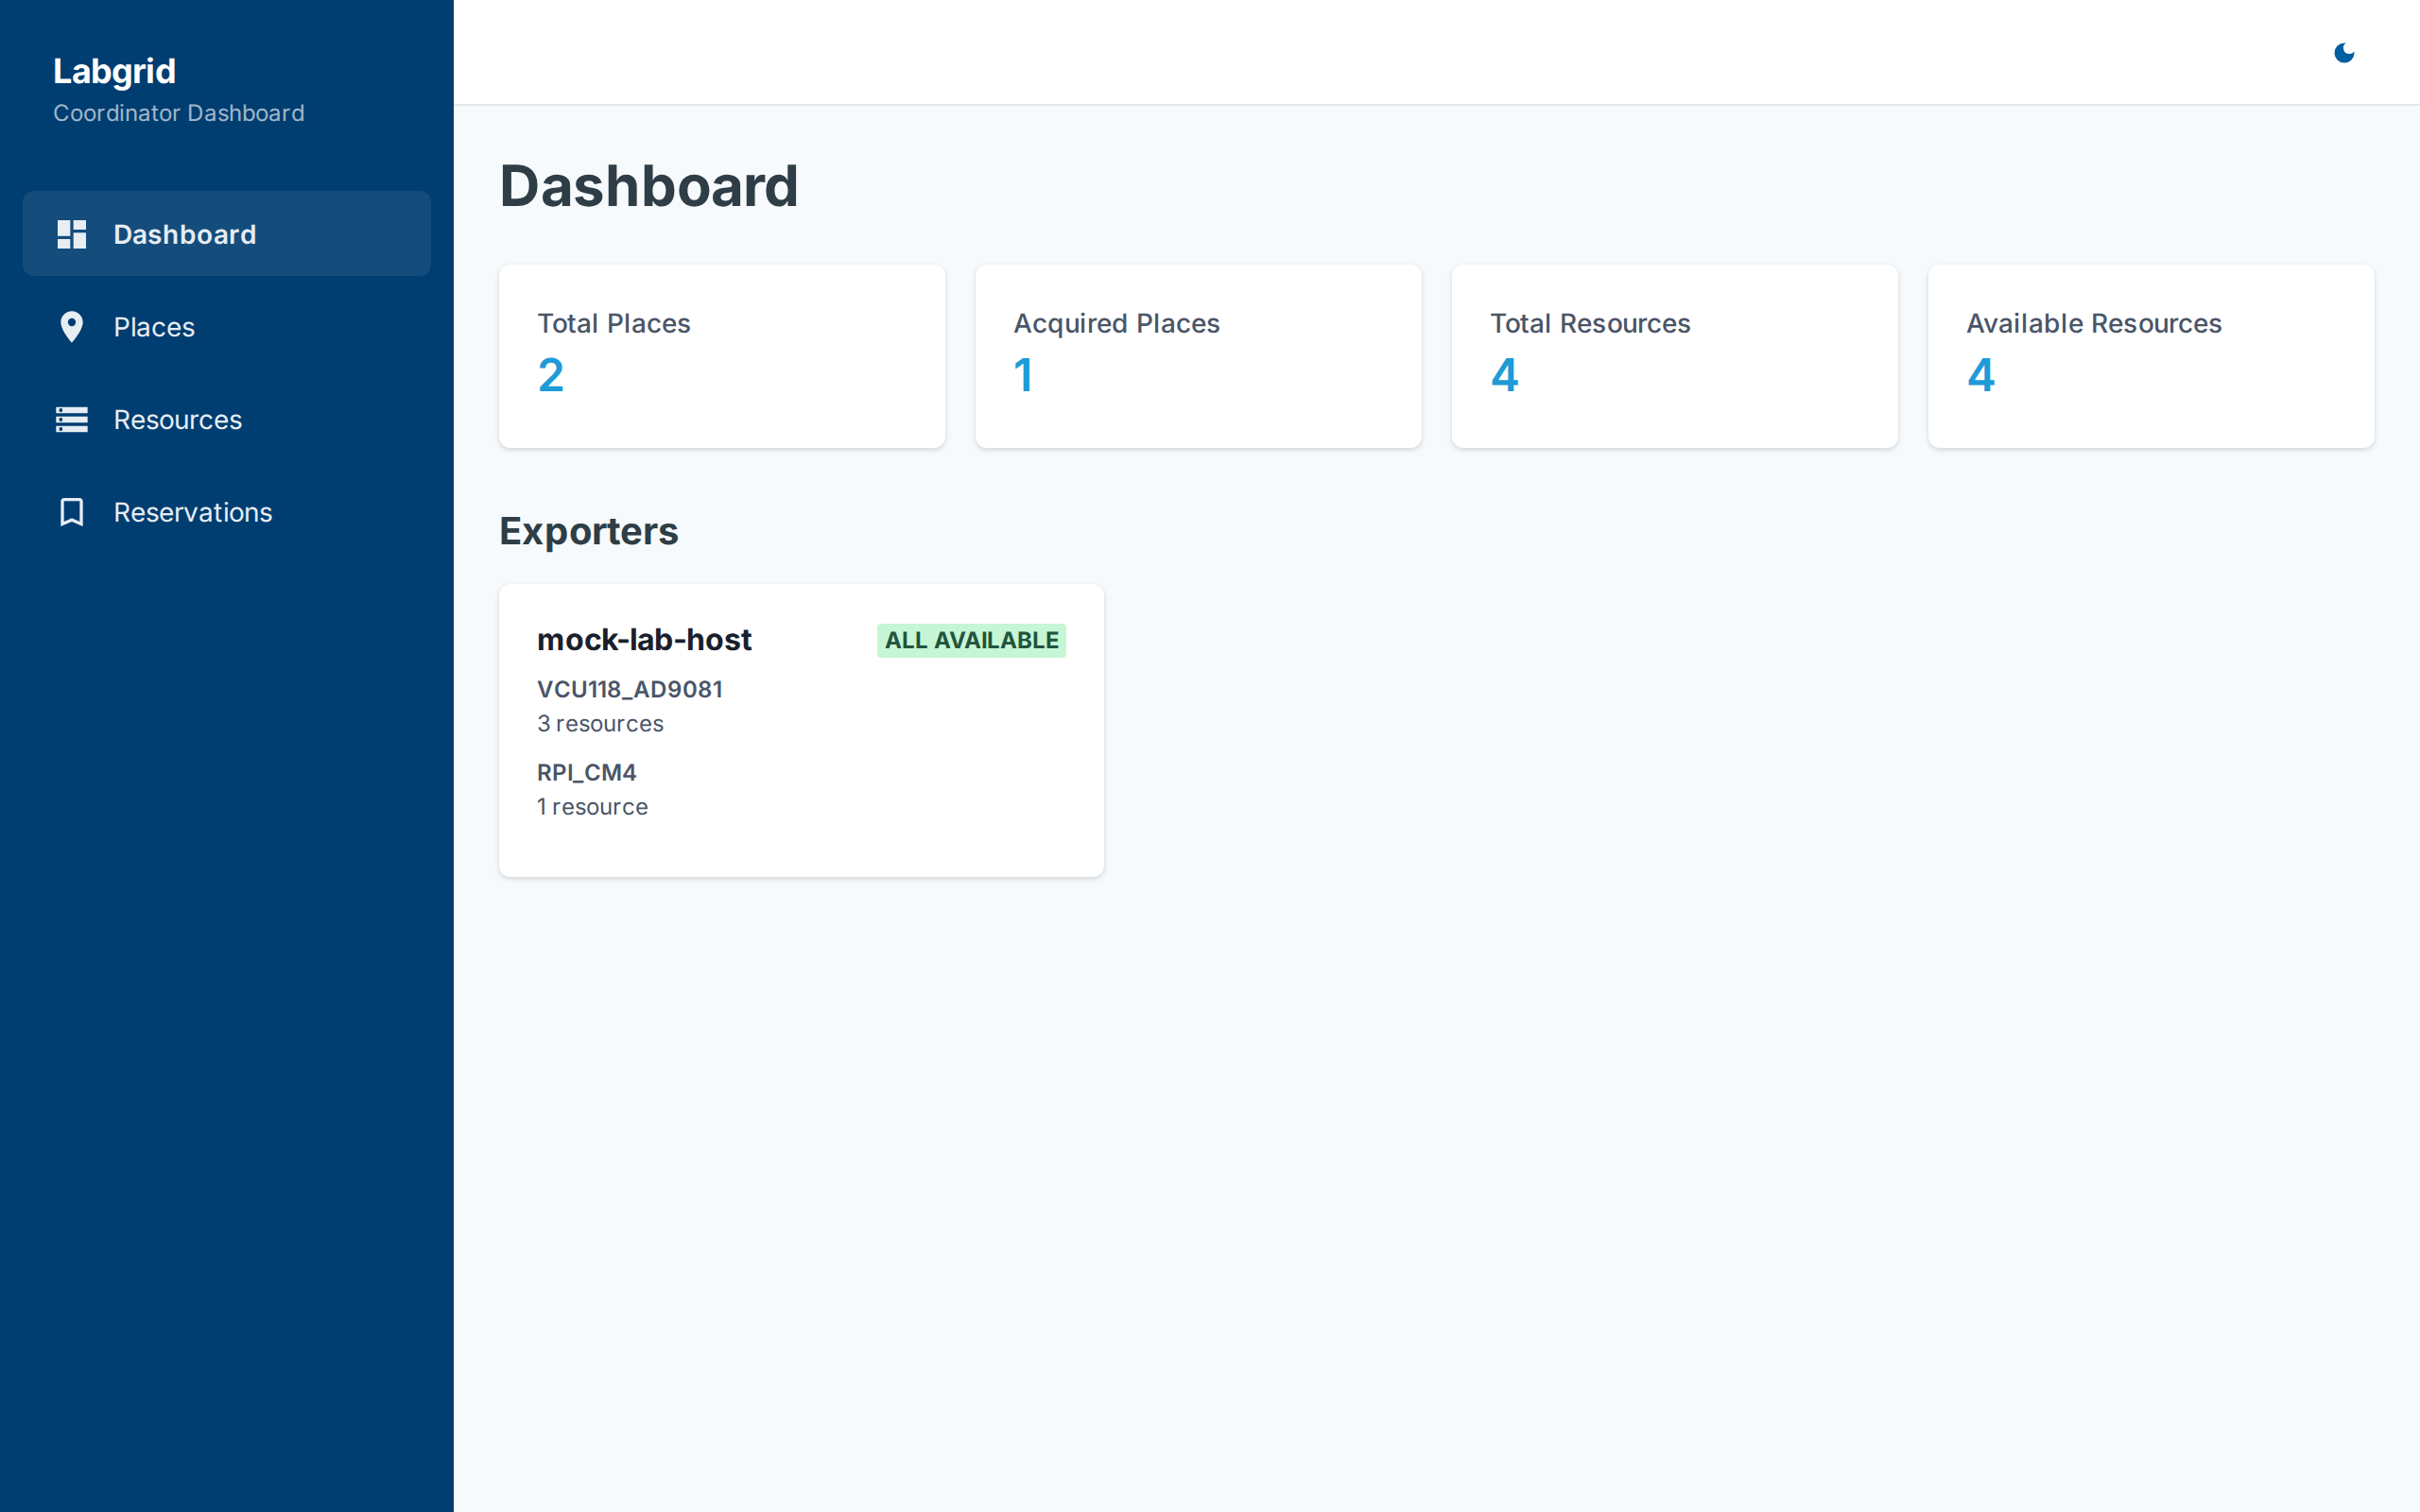
Dashboard Page
The main dashboard shows:
Summary cards: Total places, acquired places, total resources, available resources
Exporter health grid: A card for each connected exporter showing its resource groups and availability status (green/yellow/red badges)
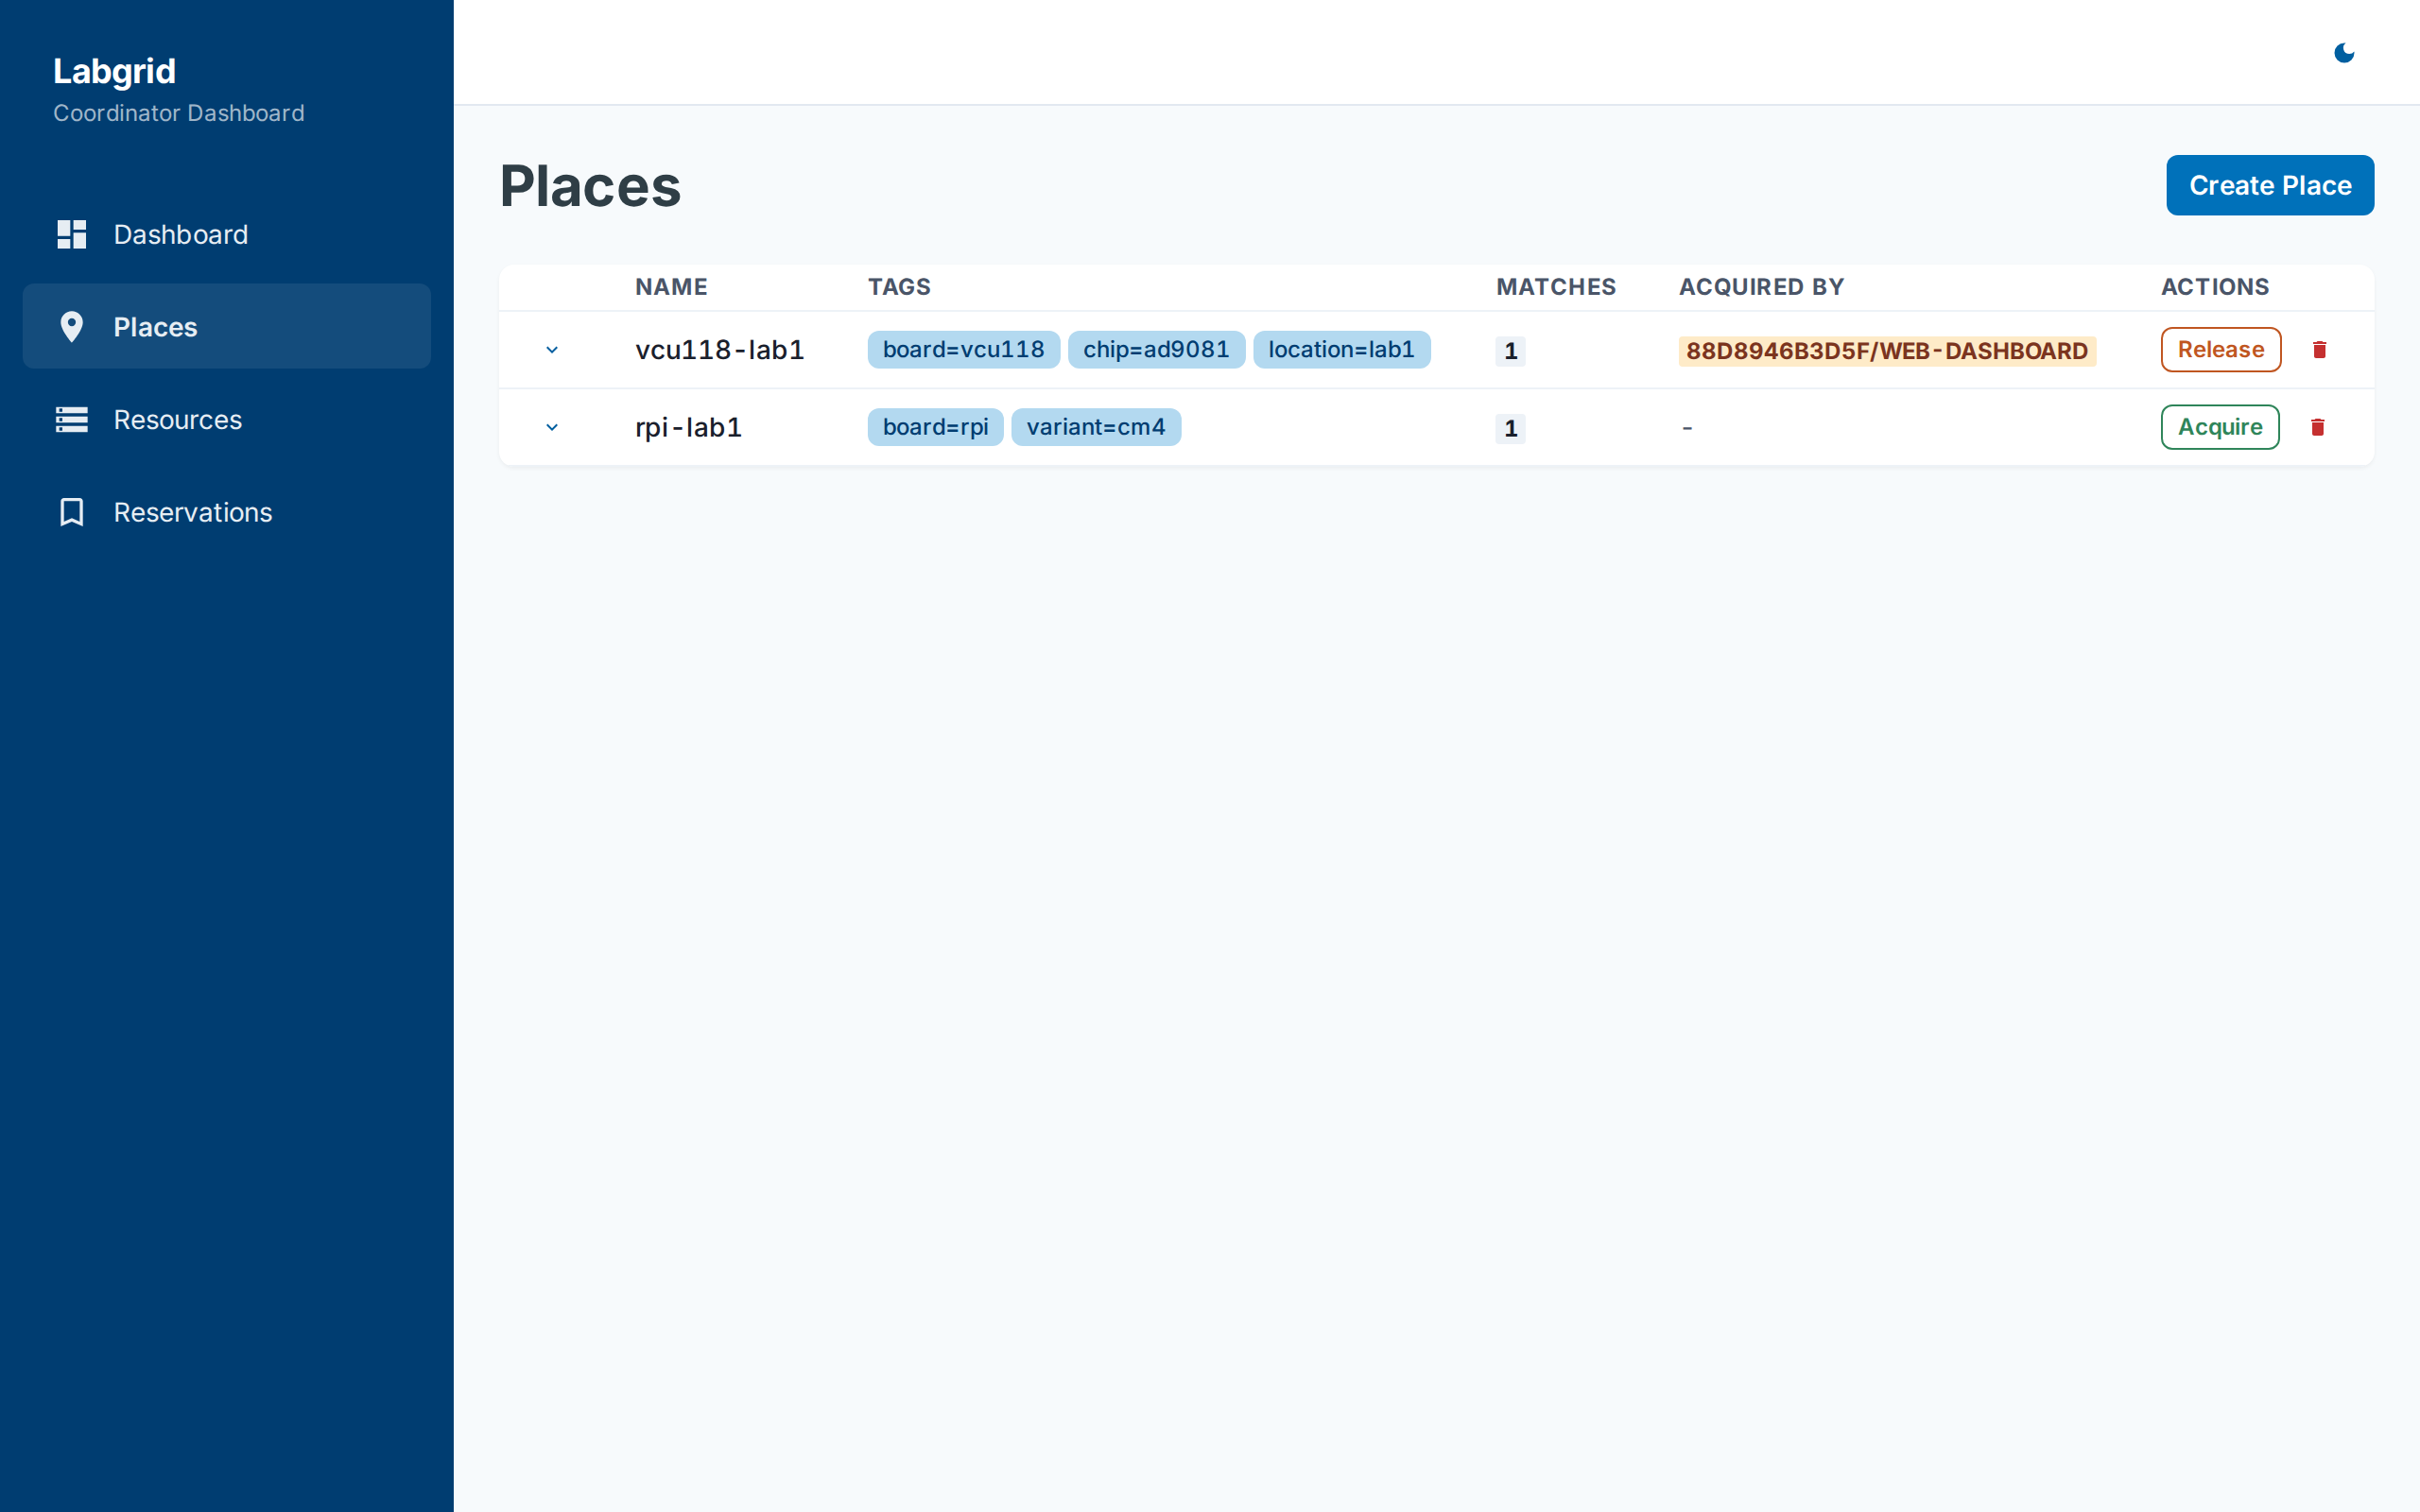
Places Page
The places page provides full place management:
Table view: Name, tags, match count, acquired by, and action buttons
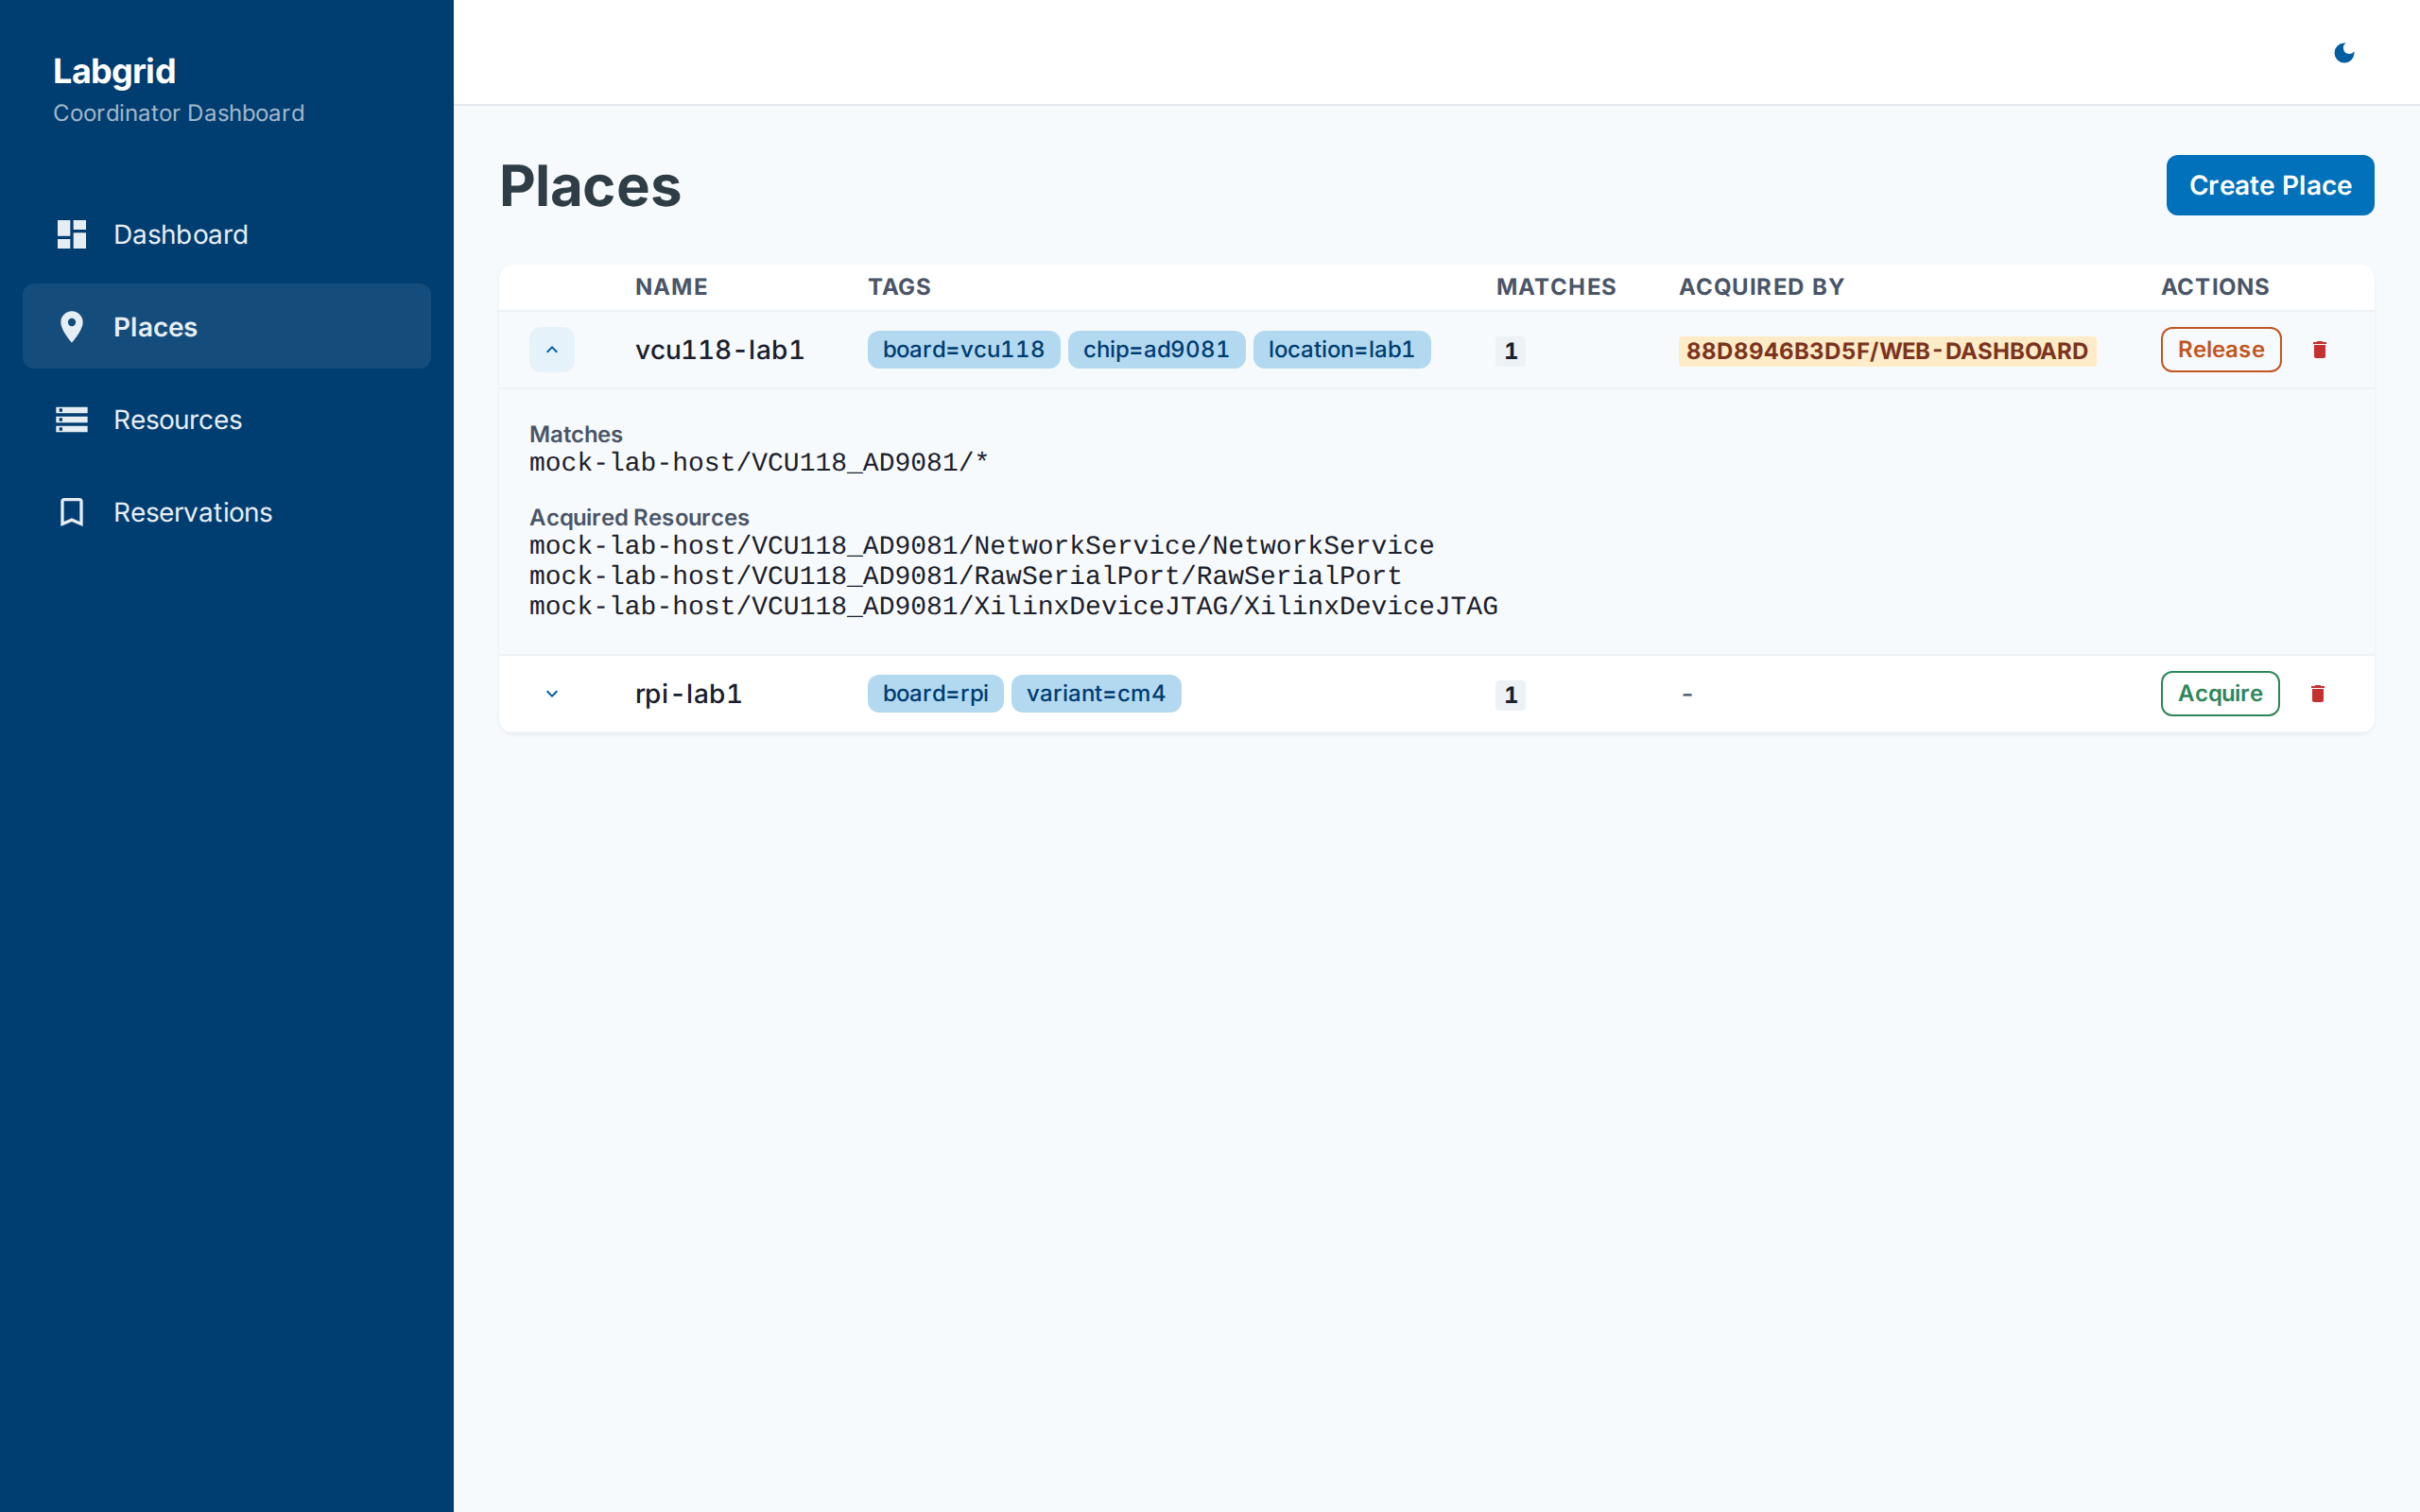
Expandable rows: Click a row to see full match patterns, acquired resources, aliases, and comments
Actions: Acquire/Release toggle, delete
Create Place: Modal dialog for creating new places
Clicking a row expands the detail panel, showing match patterns and acquired resources:
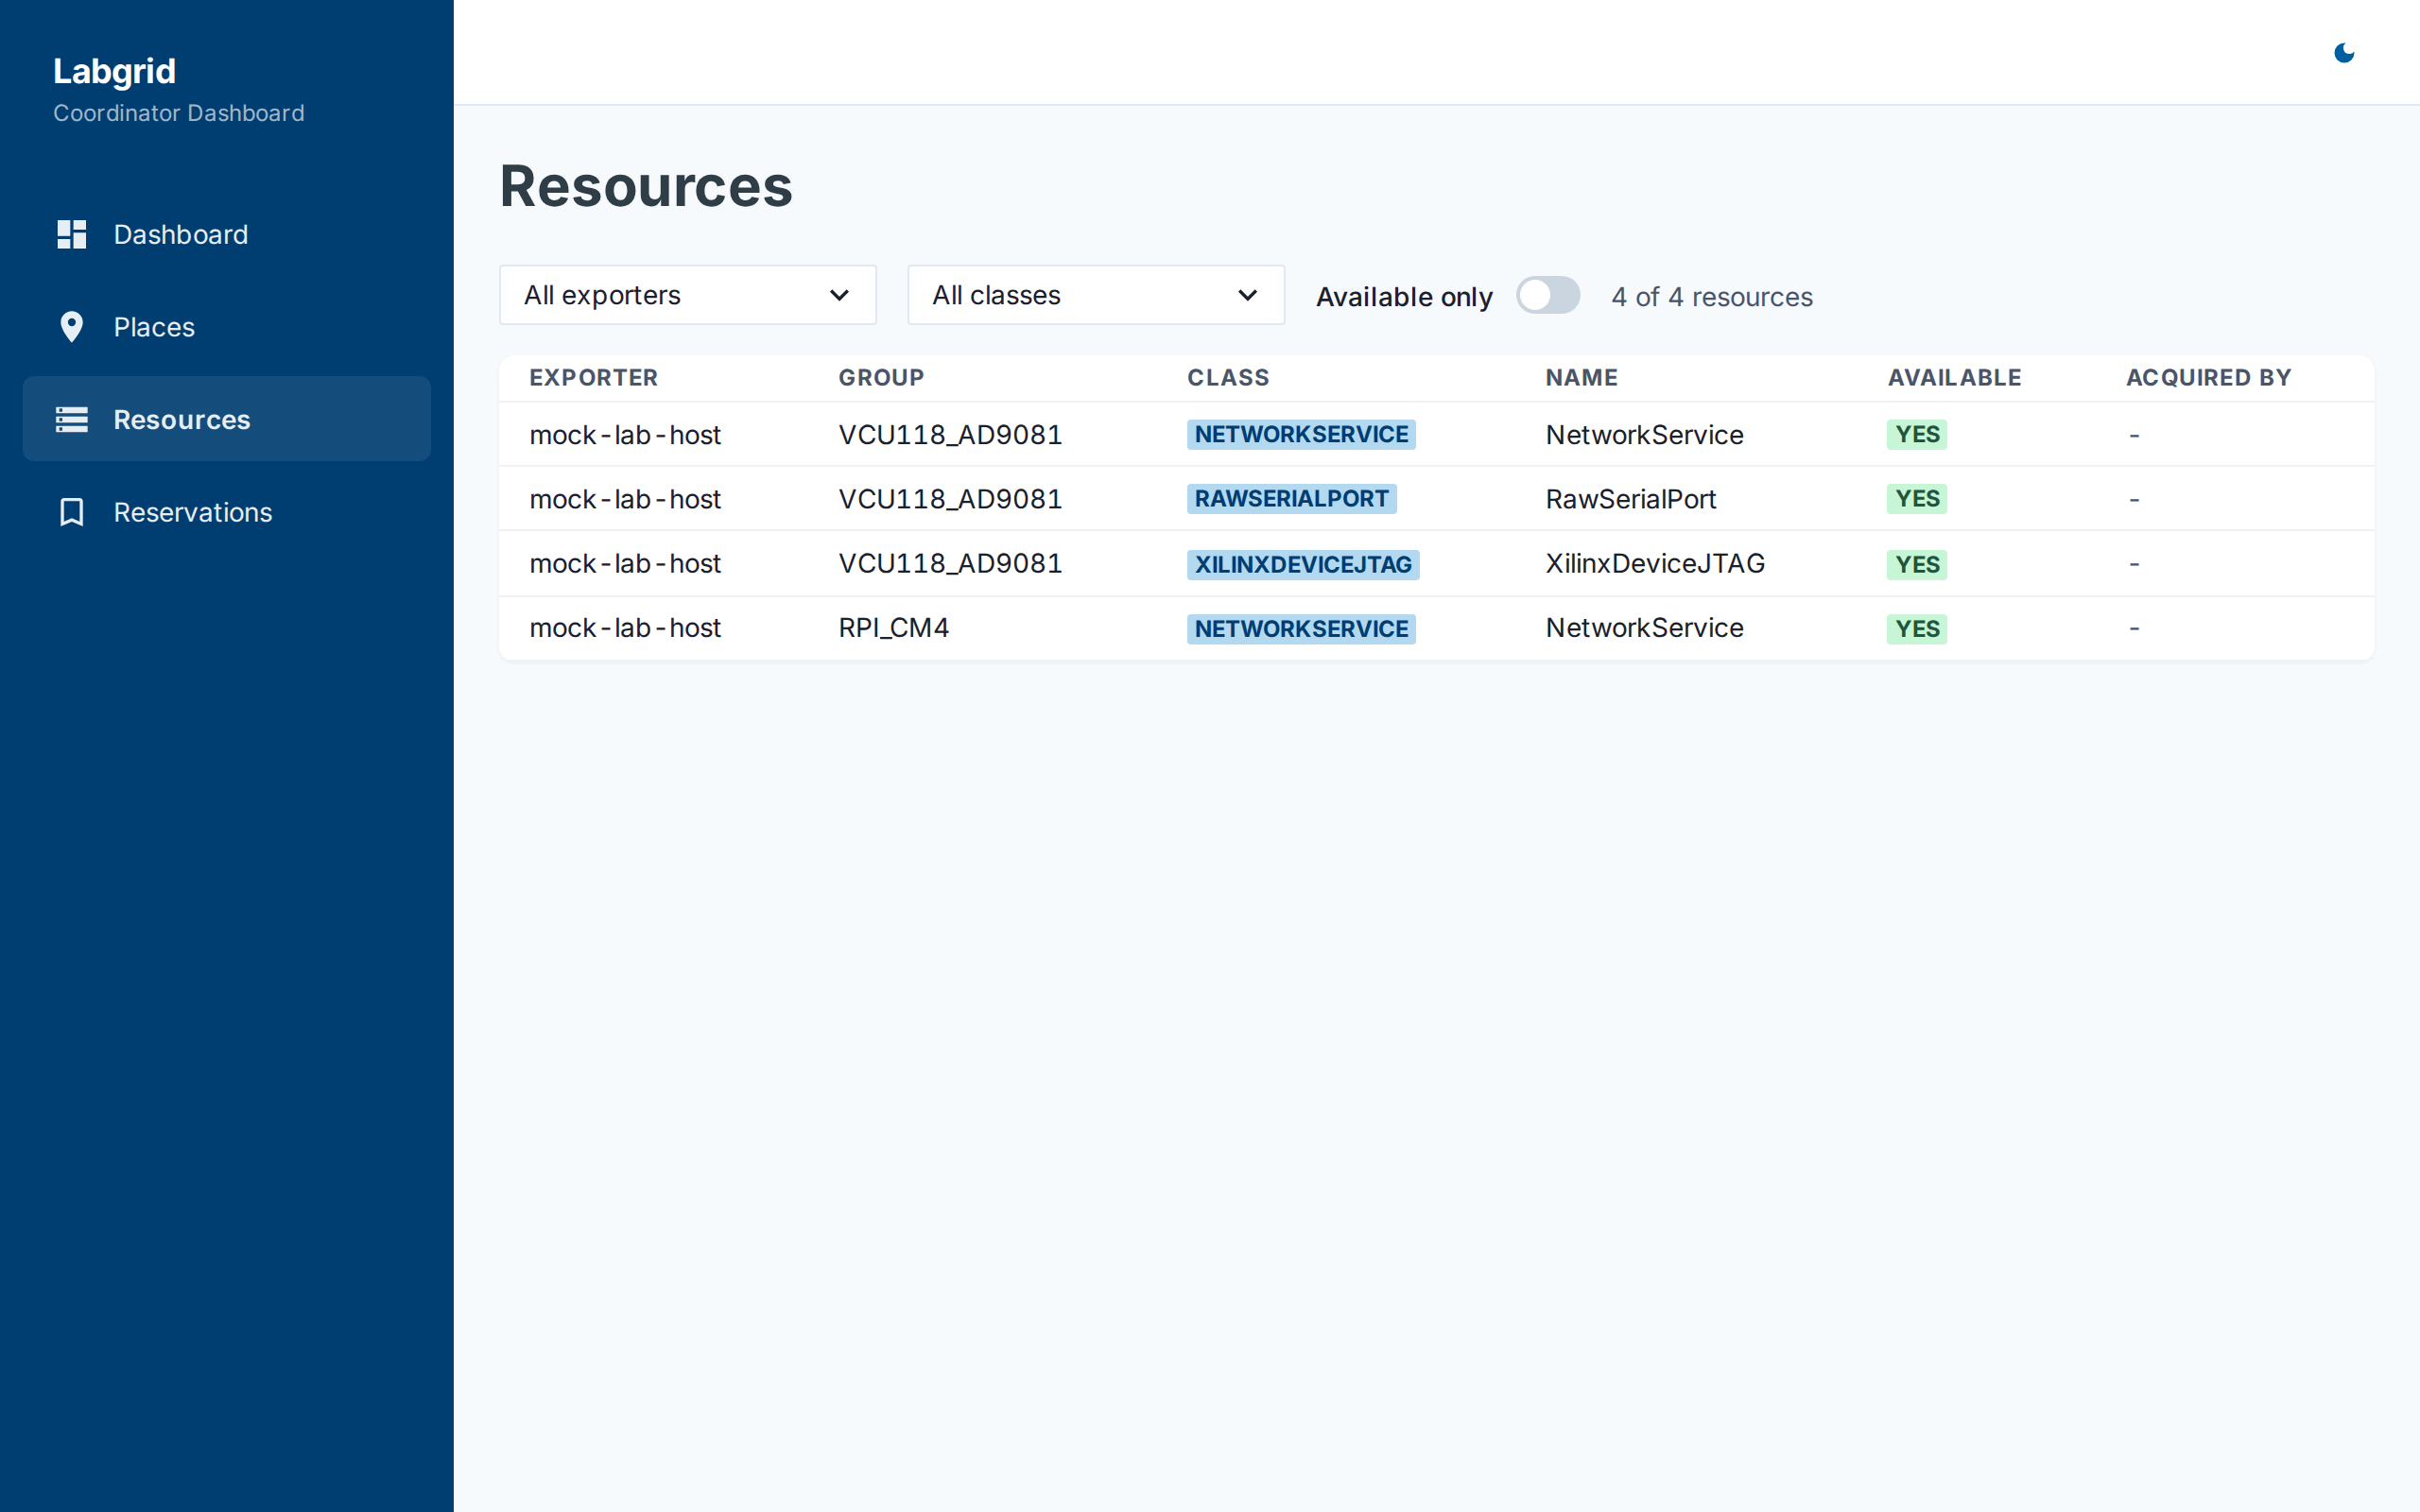
Resources Page
The resources page shows all resources from all connected exporters:
Filterable table: Exporter, group, class, name, availability, acquired by
Filter controls: Dropdown filters for exporter and class, toggle for available-only
Real-time updates: Resource availability changes are reflected immediately via WebSocket
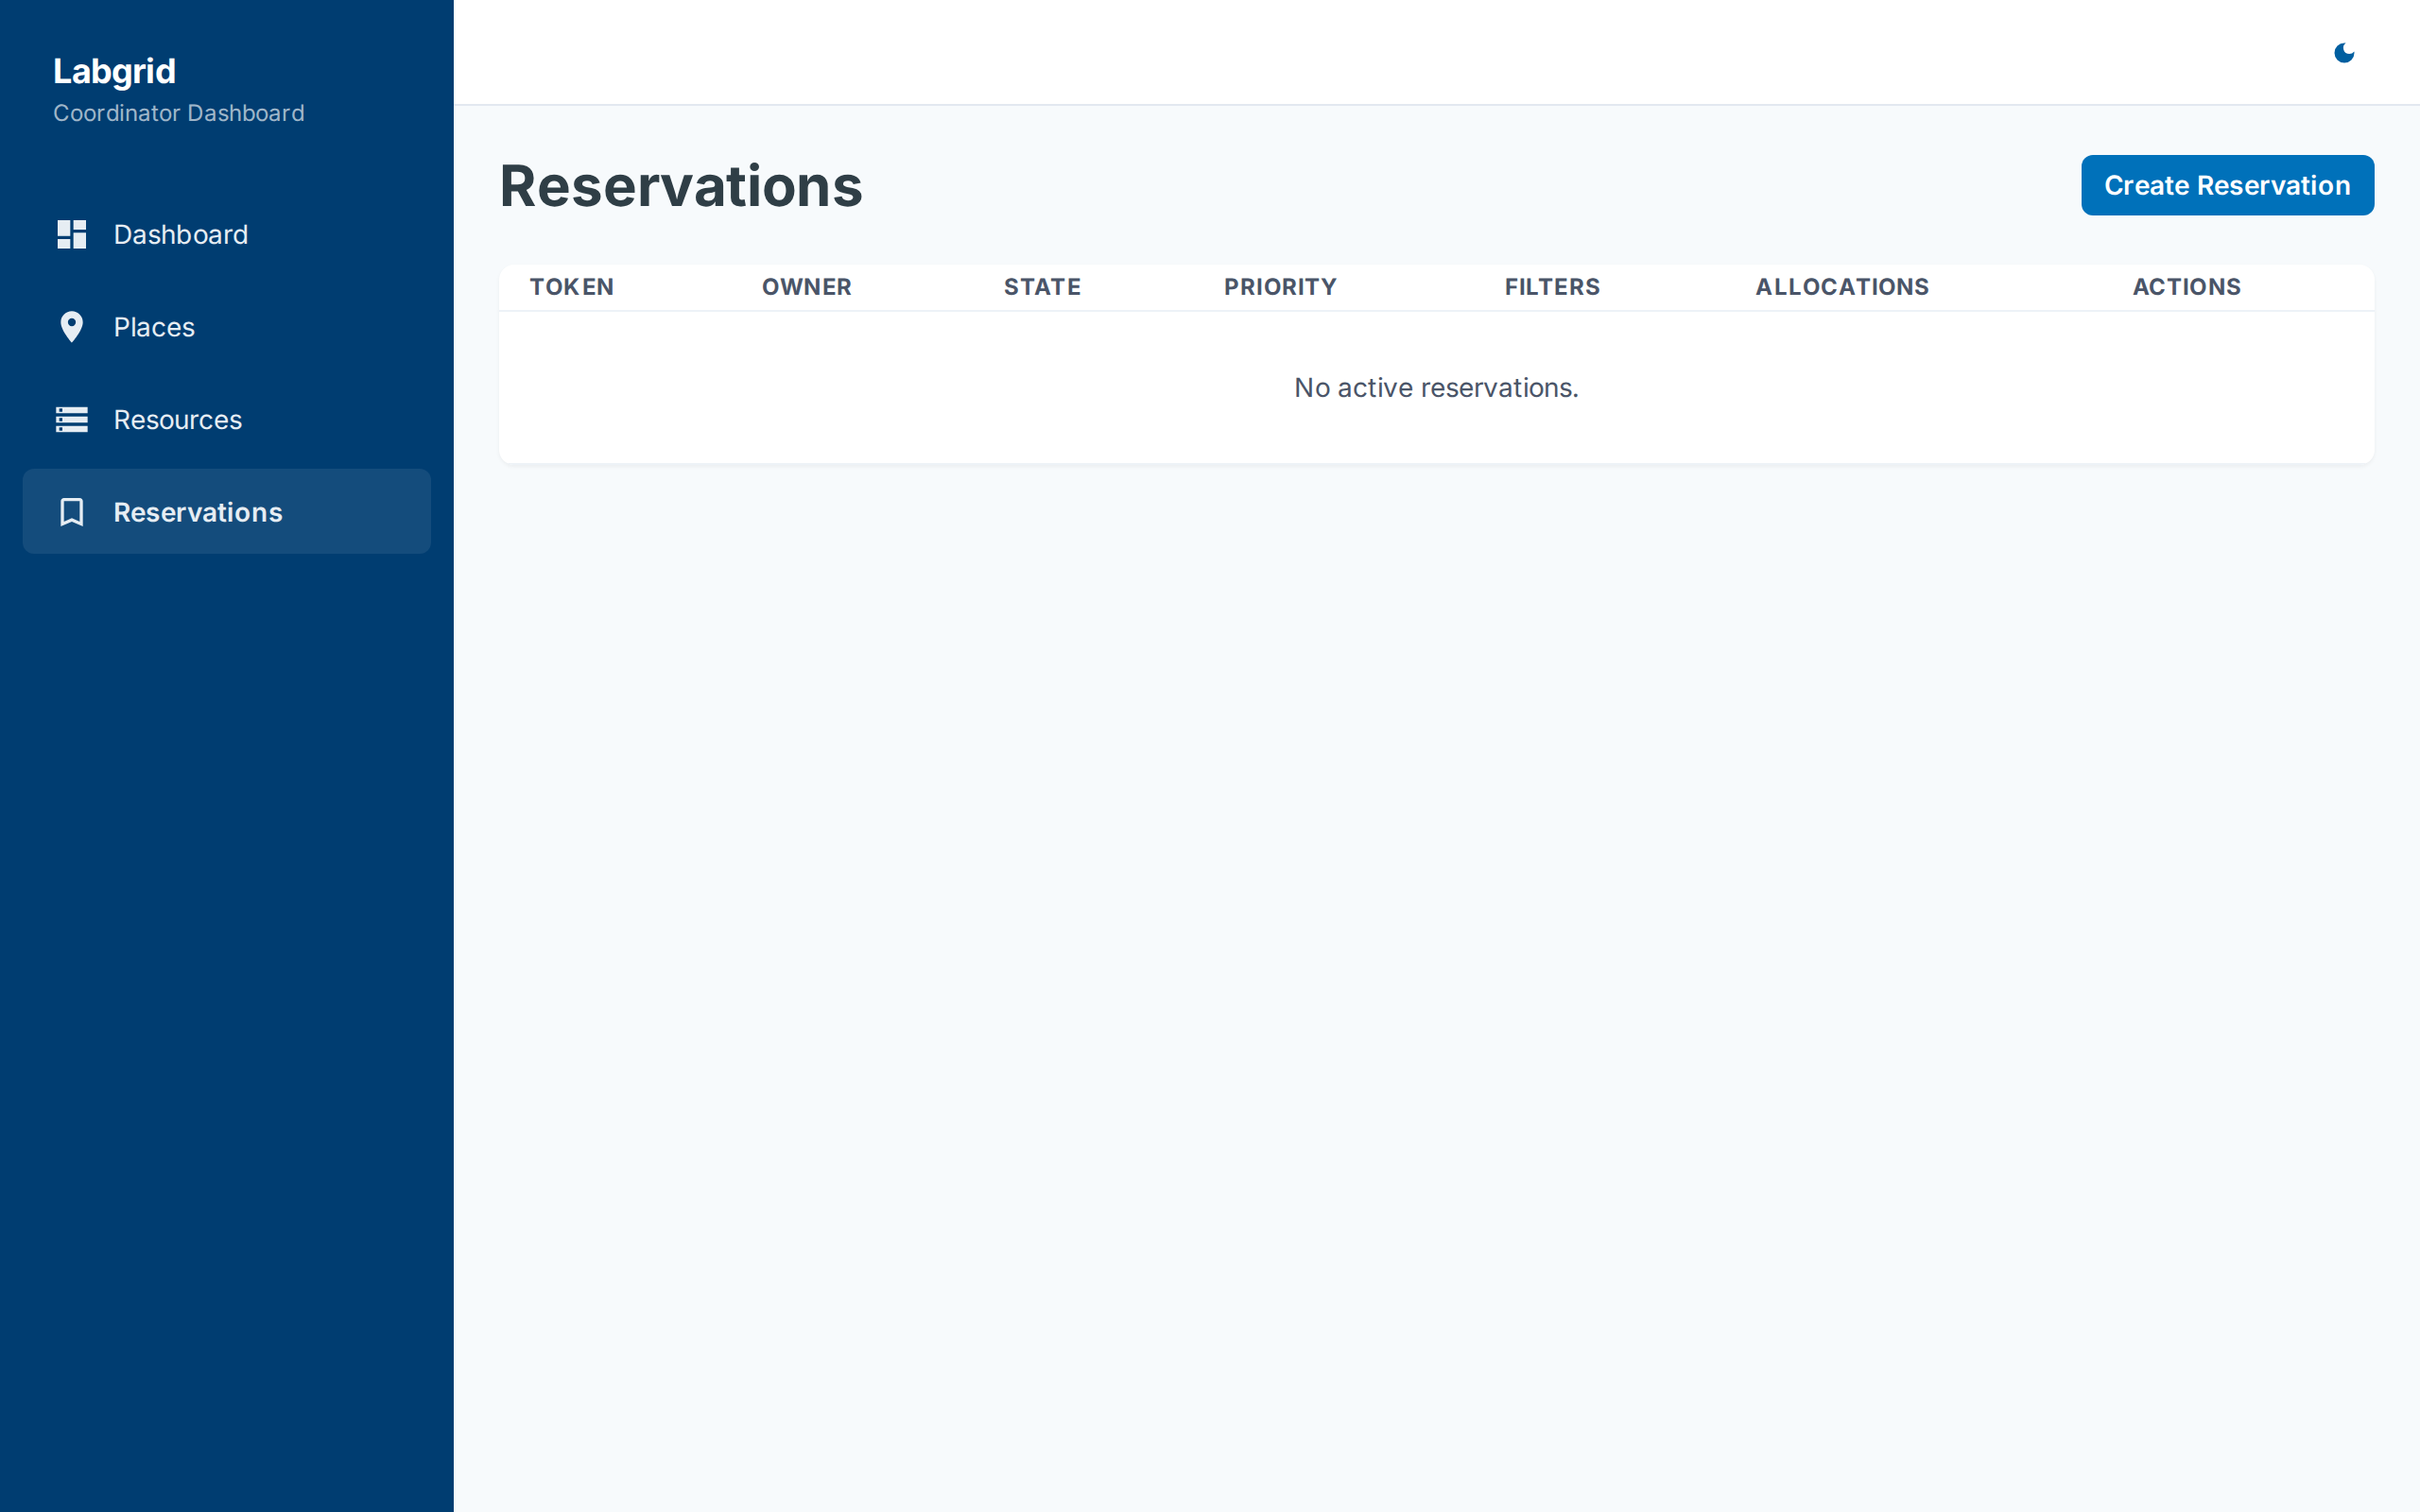
Reservations Page
The reservations page manages resource reservations:
Table: Token, owner, state, priority, filters, allocations
Create Reservation: Modal form with tag-based filter configuration and priority setting
Cancel: Cancel active reservations
Real-Time Updates
The dashboard connects to the API via WebSocket at /api/ws. All state
changes from the coordinator (place updates, resource availability changes,
exporter connect/disconnect) are streamed to the browser in real time.
If the WebSocket connection drops, the dashboard automatically reconnects after 3 seconds.
Color Mode
The dashboard supports both light and dark modes. Toggle via the icon button
in the top-right header. The color scheme uses Analog Devices brand colors
(ADI blue #0071ba) throughout.